LORENZ DEEPMAX
DATA LOGGER
To generate colour, image, surface or contour maps with the Lorenz DEEPMAX Z2, additional Hard- and Software is necessary!

To generate colour, image, surface or contour maps with the Lorenz DEEPMAX Z2, additional Hard- and Software is necessary, like an USB data transfer cable, Battery + GPS module (Power Bank), Lorenz Scripter Software with installation instructions available on our website for free download at Service and a Surfer software single user license available directly at Golden Software as well as a computer running on Windows.
A very sophisticated multi channel data logger function of the DEEPMAX Z2 metal detector will take simultaneously different channels of data when passing the ground with several tracks and stores the information into memory when this DLOG function is selected. After recording field data the scientific Surfer Software easily and accurately transforms the stored data into colour, contour, surface, image or vector maps on a computer in minutes. An additional Lorenz Scripter Software will therefore automatically generate twelve maps with each field. Six are two-dimensional and six threedimensional.
The operator can therefore choose between different gridding and mapping methods.
The LORENZ DEEPMAX Z2 Data Logger Hard/Software developed by Lorenz Detecting Systems is first of all easy to use, very accurately working and affordable. Only three controls of the DEEPMAX Z2 will make data acquisition a pleasure for both beginners and professionals like engineers, geologists, archaeologists, scientists and many more. The users will investigate mainly for waste disposal, meteorites, or lost aircrafts.
No non- sense functions will confuse the operator.
Six different maps will be generated simultaneously when covering the ground with multiple tracks.
Each scan/ map is different depending on the electronic analysis method and therefore will not only give different sensitivity ranges but can be the key to the probable kind of metal buried in the ground.
There is clearly a difference in the signature metal objects and ground conditions will give for example.
Areas of disturbances in the scans will directly lead to the different metals or ground signals and therefore can be classified in different ways. The operator therefore can use the scans to his advantage in order to choose between the metal objects of most interest only by comparing the different scans/ maps. Three delay channels will produce maps with different sensitivity to small and large metal objects, while giving indications to magnetic soils as well.
Two ground channels will enable the operator to generate maps with no ground response but Z dimensions for different decay curves of the eddy currents produced in low or high conducting metal objects.
In addition, the metal classification channel will display the time delay of the eddy currents of each signal with a specific colour to give further information on the probable kind of metal in the ground. No matter how strong the ground is mineralized or how many different metals are located in close proximity, this new device will ensure very good results even with difficult surrounding conditions. Faults produced by the operator or the environmental conditions like overload signals will be immediately seen when comparing the six channels. In addition GPS data is also recorded from an optional Battery + GPS module to support the user with a compass function a length measurement of each track and also provides the coordinates of the starting point of each field in the colour maps.
The GPS can be turned on and off when pressing the BAT/GPS button of the Power Bank for a longer duration.
A green light will flash shortly when GPS is on.
In the case that an additional external GPS is connected to the Power Bank there will appear two short green flashes instead of single flashes. If pressed shortly the battery condition of the Power Bank will be displayed with four red lights.
To start the data logger and collect field data find a point in the left corner of the field and also mark each corner of the field you are going to scan.
Fields of 20m x 20m or 10 x 20m make sense. It makes no sense to scan very narrow fields with three tracks only! To be sure that there is no overlap simply use the width of the coil like 1m for a 1mx 1m frame when walking each track. It is important to proceed with the tracks from the left to the right since the visualization software will work the same way!

SAVING FIELD DATA WITH THE LORENZ DEEPMAX Z2 DATA LOGGER
- Mark a field in the four corners and start in the left corner X/Y with a frame coil 1 m x 1 m in size for example.
- Turn on the DLOG function with 1 for normal or 2 for highest Sensitivity. In this mode only a few functions can be changed or displayed, all the other functions are shown with a P for preset and cannot be altered.
- Keep the coil at the left starting point where X and Y lines meet and press ZERO shortly and immediately start to walk the first track while keeping the coil at constant height over the ground. A pulsed beep sound will indicate that the data acquisition is in progress. Walk at a constant speed while recording the field data.
- Press ZERO at the end of the first track in order to store the same track in the internal memory. A double tone beep sound will confirm that the data is stored in memory.
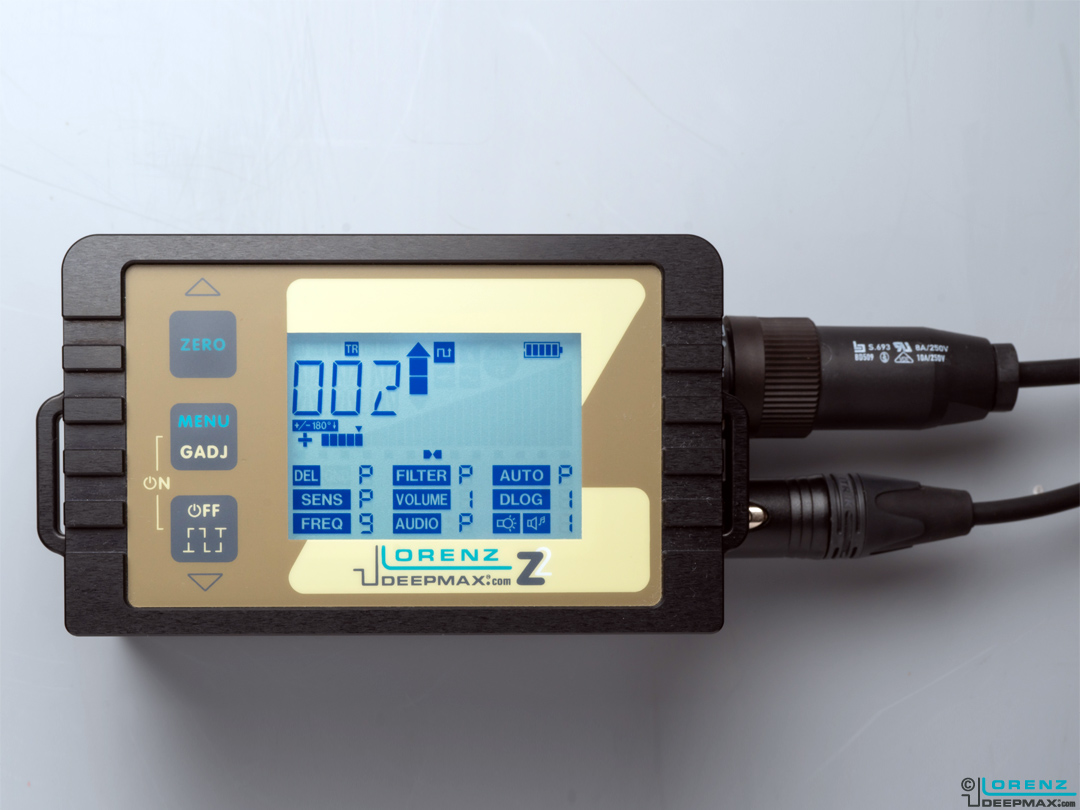
- Turn around 180 degrees and start the next track backwards for example 1m next to the first one pressing ZERO to start. Avoid overlaps of the tracks when searching track by track.
- Stop the last track with ZERO and store the same as a new field while pressing OFF/ FIELD shortly afterwards.
- Leave the DEEPMAX Z2 on and connect the USB data transfer cable to the DEEPMAX Z2 and read the data with your computer and installed Surfer and Lorenz Scripter Software, as described in the instructions free for download on our website at Service.
- Compare the six different colour maps generated with Surfer to distinguish between different kinds of metals, objects sizes, orientation and ground minerals.

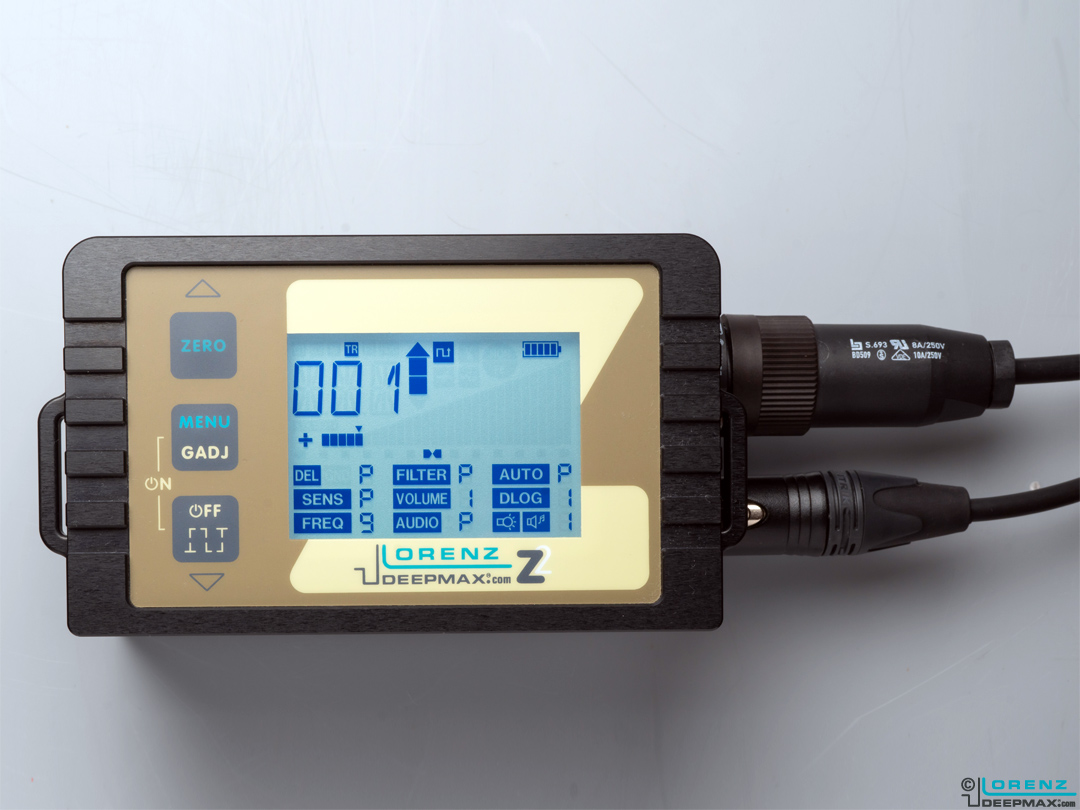
In addition, there are different indication icons on the display to make the operation of the data logger even simpler as follows:
- M Meter displays the meters already passed in the first track and counts backwards in the following tracks to zero in order to find the starting and finishing line X of each track.
- TR Track indicates the currently active track and the amount of tracks already being stored.
- FI Field indicates the field currently in use and jumps to a higher number when storing the last track with the FIELD button shortly.
- HDG Heading information of the compass function to display the direction of the tracks in Y direction. While being in the process of recording field data it is possible to press MENU in order to choose between Meter, Track, Field and Heading information on the display
- +/-180° comes on when walking backwards a track in order to show that this amount of degrees has to be added or deducted from the displayed Heading to obtain the compass heading.
- GPS has to come on when a Battery + GPS module is connected the GPS is turned on and DLOG 1 or 2 is selected and starts to flash when no accurate
GPS data can be received or during the warming up phase. The Z2 will work without GPS as well but does not provide the compass heading and meter function in this case. - DATA LOGGER operation icon comes on when DLOG is on.
- BARGRAPH dot for compass heading information shows the operator how to go in straight line each track. For example, the operator has to go to the left when the dot goes to the left or to the right when the dot drifts to the right. This has to be performed as long until the dot comes back to the middle. The operator will notice some delay until this indication reacts. It is absolutely necessary that the operator walks to make a valid GPS indication possible.
Therefore at least ten meters should be passed until the indicated GPS data is tolerable accurate. USB icon comes on when - USB data transfer cable is connected with the computer and data transfer is in process.
All mentioned functions, settings, specifications and indication examples subject to change without notice.
ANALYZING FIELD DATA
Although the detector can be used with smaller search coils the data logger function is mainly developed for larger metal objects being at least 6cm x 6cm in size. Therefore, frames of 1m x 1m or even bigger should be in use to achieve best results.
To analyse the different pictures generated with the software refer to the following instructions. Compared to many other systems the Lorenz DEEPMAX Z2 will not only generate one or several graphic representations with different sensitivity ranges for the same metal objects but also gives additional information on the probable kind and size of a metal object being located. The advantages of the multi channel data logger are as follows:
- False or overload data will be easily recognized on one or two of the maps. At the same time you will find useful data on at least one or two channels.
- When looking at the different colour maps select signals in the GROUND channels and try to compare the same indications with DELAY and Identification channels.
- Some signals appear on one scan and disappear on others to give the operator more advanced information on the kind of metal (decay of the eddy currents) or the surrounding ground conditions.
- It is possible to separate two or more different metal objects which give only one large indication in the Delay channels but two or more coloured dots on the metal classification or Ground channels.
- Some longer ferrous metal objects lying horizontally in the ground will cause a special double signal when looking at the Ground channels.
- Ferrous metal objects will only give weaker signals in Ground modes and therefore a small indication in Z direction in the three dimensional surface maps only.
- Looking at the Ground channels most of the ground and some of the smaller ferrous items will no longer be displayed when comparing them with the Delay channels.
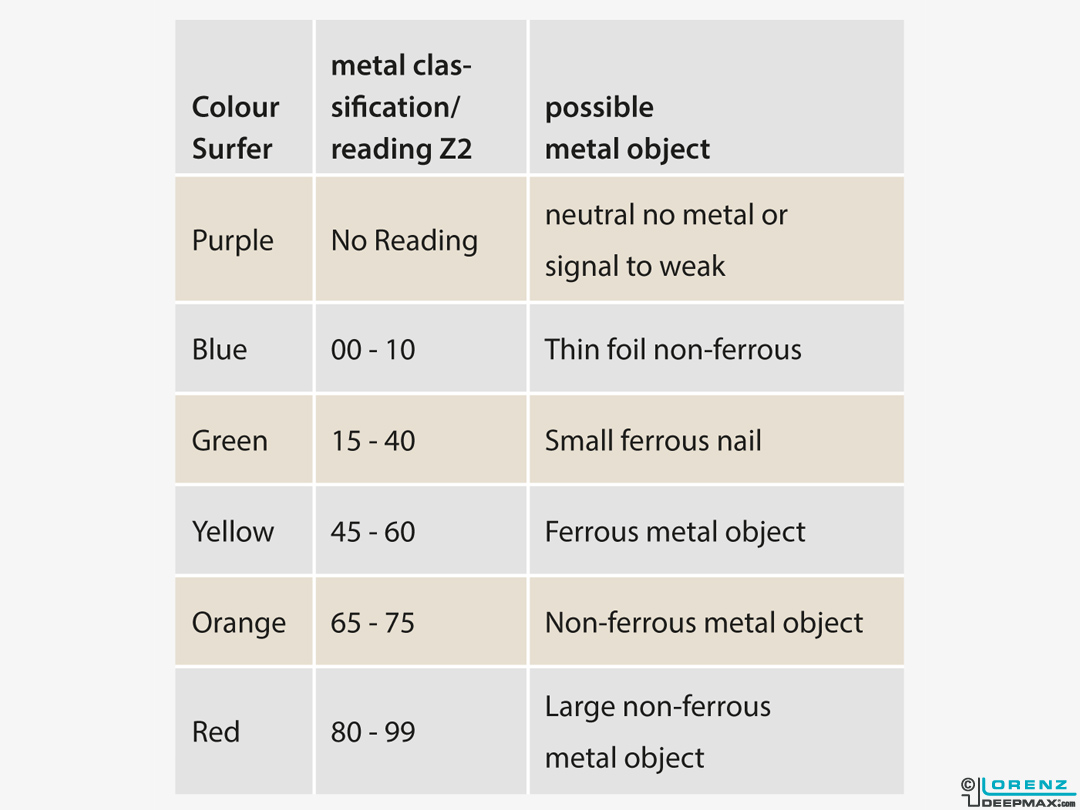
- On the metal classification pictures stronger signals which generate a conductivity reading will produce mainly a single colour dot corresponding to the delay reading on the display of the DEEPMAX Z2. Neutral ground will cause a purple indication.
Different nearby metal objects lying in close proximity will give different colours in most cases for better selection. See table of metal classification indications.
Previous Products
These information are gathered specially for the DEEPMAX Z2.
For Datalogging with an previous LORENZ product, please have a look in the products manual. You’ll find them at our Service-Page.